The Hidden Political Party
2022-06-20 · 4 min readA cluster analysis of tweet sentiments to find sub-political parties! Hopefully this can help people understand the political landscape a little more & understand humans just a little more.
POLITICS!
It's a crazy time of the decade where it seems like everyone is disagreeing about something (rightfully so in some cases). In light of these differences, it still amazes me how we manage to split the country into only two parties with seemingly infinite sides to infinite problems. With these infinite variations, dividing everything into a clean two usually comes with a lot of nuance, along with tons of compromise & conflicting views for both sides. In reality there should be ideologically many parties, so I set out to see if I could derive any insights from this mathematically.
The Process
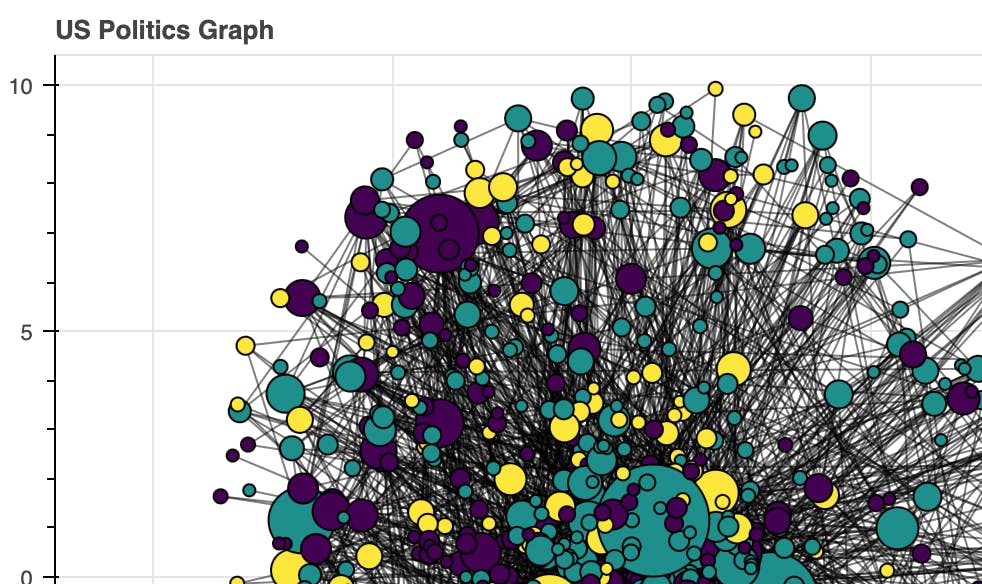
First I started off with a public dataset of most of the major US politicians twitter accounts. Once I consolidated all of the identifying usernames, I scraped all of their current tweets in their profile up to around 300. Taking mentions into account, I build a graph where every person was connected with the people they had mentioned in their tweets.
Ending here, this should give us a graph where when visualized shows the "relatedness" of different politicians. The problem here is that it doesn't take into account if the relation is negative or positive (two people could be bitter rivals, or political bros). To do this I took sentiment of the tweets into account, letting that control the weightings of the graph, essentially creating a weighted undirected graph which could be used as a representation of the current political state of the US. This is of course going to not be extremely accurate to the complex relations of the real world, but it should act as a good approximation of outward personas.
With this I was able to use clustering algorithms! This could be used to figure out sub-political parties.
The one I ended up settling with was the Louvain Heuristic for clustering because my dataset was relatively large with many connections. With this I let it classify itself into different sub-groupings.
Insights
Okay so onto the clickbait-y title... One of the most (or least because I partially predicted it) surprising aspects was it didn't identify just 2 political groups! Looking into the groups, it seemingly put all the politicians in one of 3 groups (which I'll name now)—Left Democrats, Conservative Democrats, and Republicans. The model found that the left wing was indeed divided into two major groupings, with one actively fighting for more extreme legislation, while the other mainly stayed more conservative to the status quo. Republicans on the other hand were mostly sorted into their own group.
This could be attributed to two large reasons: either the Democratic party is outwardly debating issues due to being in the presidential term, or a new more left party is emerging from the Democratic party. The former seems unlikely to me due to relatively equal control of both political parties. This leaves that there seems to be a new party either emerging, or a divide in sentiment.
This splitting of the Democratic party is noticed by most people, further supported by the graph, and is remedied during political elections where people need to band together. The larger problem is for legislation, this isn't solved due to infighting in the Democratic party, while Republicans stay relatively unified.
So what? Something that could be done is while there are similar numbers of Left Democrats versus Conservative Democrats, Left Democrats get much more mentions and media attention. This could possibly mean a party division would be favorable to garner more support from Conservative Democrats.
It would also be helpful to see more formal debates between both types of Democrats to decide the future of the party as a whole, without framing its identity being "anti-Republican".
and.....
Overall this was a fun side project and definitely something I want to try doing more! Implementing data science techniques to real political problems is super cool, and deriving real insights is exciting! I've linked the actual graph visualization so you can take a look at it and hopefully find something interesting. Hopefully you found this insightful!
See you soon, and keep hacking!
